


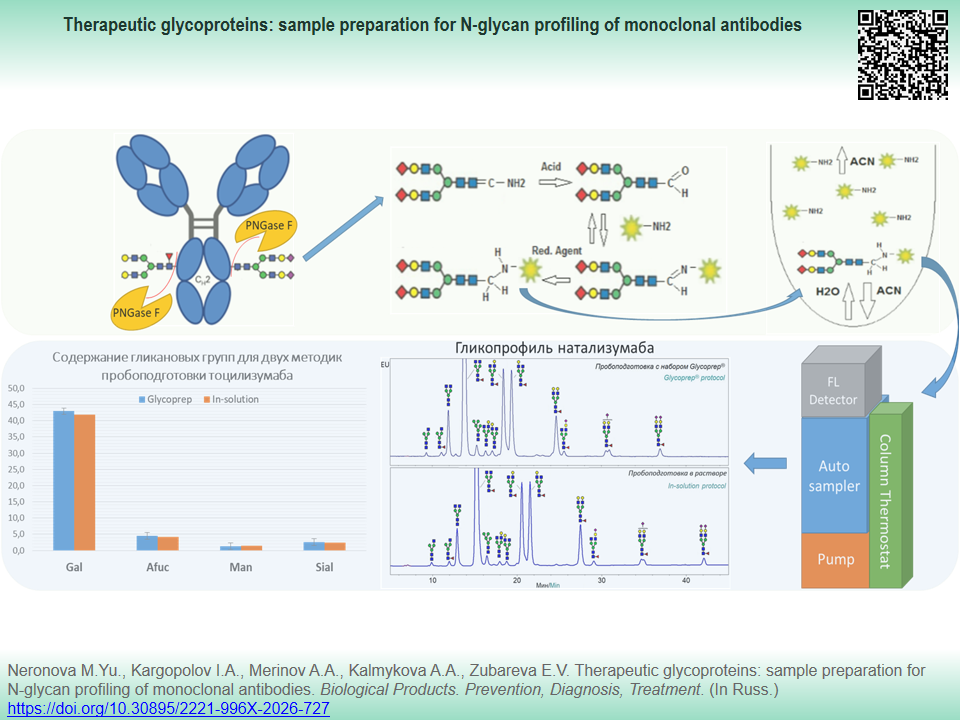
INTRODUCTION. Glycan profile is a critical quality parameter for therapeutic monoclonal antibodies (mAbs) that is consistently estimated during development and release of each drug batch. The need to develop a reproducible sample preparation protocol for glycan profiling brings about the relevance of the study. The profile should be adapted to the conditions of a standard physicochemical laboratory, so that it avoids using commercial preparation kits that are currently in short supply.
AIM. This study aimed to develop an alternative sample preparation procedure for quantitation of glycans in therapeutic monoclonal antibodies without using commercial kits.
MATERIALS AND METHODS. Omalizumab, ustekinumab, canakinumab, tocilizumab, natalizumab, and human anti-PD IgG2 were used as the study objects. N-glycans were released from mAbs by peptide-N-glycosidase (PNGase F) and labeled with fluorescent tags 2-aminobenzamide (2-АВ) or 2-aminobenzoic acid (2-АА) or InstantAB. Subsequently, glycan samples were cleaned from impurities. Glycan compounds were analyzed using hydrophilic interaction liquid chromatography (HILIC-FLD) on Alliance e2695 and Acquity Arc Bio chromatographic systems equipped with FLR 2475 fluorescence detector. The glycan profile was assessed by the content of functional glycan groups.
RESULTS. Conditions for preparing therapeutic mAbs N-glycans were chosen as follows: incubation with 2 mEU PNGase F per 100 µg protein in 10 mM Tris-HCl (pH 8.0) at 37 °C for 3 h without protein denaturation; derivatization of glycans with 2-AA at 65 °C for 1.5 h; extraction of 2-AA excess with acetonitrile. Centrifugation of labeled glycans with acetonitrile is suitable for purification and concentration of samples. Minor glycans with a content not more than 0.1–0.2% were determined using HILIC-FLD. Comparison with data obtained using a commercial kit for sample preparation indicated acceptable comparability of the results. When preparing the samples, we took into account structural features of specific mAbs, for instance, desialylation control during the staining was found necessary for high-sialylated mAbs.
CONCLUSIONS. The developed sample preparation procedure is suitable for the analysis of N-glycans of omalizumab, canakinumab and natalizumab and may be used to develop the analysis methods of the glycan profile of other glycoproteins using HILIC-FLD mode.

INTRODUCTION. In the absence of an international reference standard for the antigen and the corresponding antiserum for quantifying influenza virus hemagglutinin (HA) content by single radial immunodiffusion (SRID), as well as during pandemics or other emergencies, validated alternative methods for HA quantification are required.
AIM. Optimization of the method for certifying a primary reference standard for quantification of influenza virus hemagglutinin using sodium dodecyl sulfate-polyacrylamide gel electrophoresis (SDS-PAGE) followed by densitometric analysis of the gels.
MATERIALS AND METHODS. The HA content (%) in the reference standard was determined by SDS-PAGE under reproducibility conditions (two laboratories). HA concentration (µg/mL) was calculated from the total protein content determined by the Lowry method. The SRID method was used to evaluate the accuracy of HA quantification. The CombiStats software was used for plate image processing, calculation of the squared diameters of precipitation rings, and determination of HA content in the samples. Sucrose and glycerol in the virus concentrate and the diluted virus concentrate (DVC) were quantified by high-performance liquid chromatography.
RESULTS. When performing SDS-PAGE with deglycosylation, the addition of 0.072 mM 2-mercaptoethanol for sample processing eliminates the need for urea. The HA concentrations in DVC determined by SDS-PAGE using 4–12% Bis-Tris gels in Laboratory 1 (135.8 µg/mL) and 4–20% Tris-glycine gels in Laboratory 2 (135.5 µg/mL) were virtually identical; the coefficient of variation did not exceed 4% in either laboratory. The HA concentration determined by SDS-PAGE in Laboratory 1 was comparable to the SRID data (123.6 µg/mL). The content of excipients (glycerol and sucrose) in DVC did not exceed 55 µg/mL and did not affect the results of protein determination.
CONCLUSIONS. Optimal SDS-PAGE conditions were established for certifying a primary liquid reference standard for quantification of influenza virus HA, yielding results comparable to those of the SRID method. The next phase of the study will involve testing the sample preparation conditions and quantification methods for all HA types (H1N1, H3N2, and B) relevant to the 2025–2026 season.

INTRODUCTION. Monitoring the stability of live plague vaccine production is critical for releasing an effective and safe medicinal product. Shewhart control charts represent a promising tool for this task, enabling statistical assessment of process stability based on the key quality attribute — potency (number of live microbial cells).
AIM. This study aimed to evaluate the stability of live plague vaccine production through a retrospective analysis of potency (number of live microbial cells) of batches using Shewhart control charts (X and R charts) and correlation analysis.
MATERIALS AND METHODS. A retrospective analysis of quality control results for the attribute Potency was performed on 121 batches of live plague vaccine manufactured in the Russian Federation from 2012 to 2025. Potency was assessed as the number of live microbial cells (percentage of the total cell count). Statistical process stability was evaluated using the Shewhart control chart method. Two types of charts were constructed: moving range charts (R charts) to assess homogeneity, and individual value charts (X charts) to assess process stability. Data from the manufacturer’s summary protocols and results obtained at the Testing Center were used. The Pearson correlation coefficient (r) was calculated.
RESULTS. Analysis of control charts for the period 2012–2018 revealed signs of statistical instability of the manufacturing process: both X and R charts exhibited points and trends outside the control limits (special cause criteria), indicating an uncontrolled process state and requiring corrective actions. Data from 2019–2025, obtained after manufacturing process optimization, showed stabilization of the indicators: the number of special cause criteria decreased, and the duration of in-control periods increased. Correlation analysis revealed a strong positive relationship (r=0.7) between the manufacturer’s results and those of the Testing Center.
CONCLUSIONS. Shewhart control charts are an effective tool for statistical process control in pharmaceutical manufacturing. Their application to assess the stability of live plague vaccine production demonstrated that modernization of the manufacturing process facilitated a transition from a statistically unstable state to a controlled state. The high correlation between the manufacturer’s and the Testing Center’s results (r=0.7) confirms the reliability of the quality control system. Therefore, the Shewhart chart method can be recommended for monitoring the manufacturing stability of vaccine products.
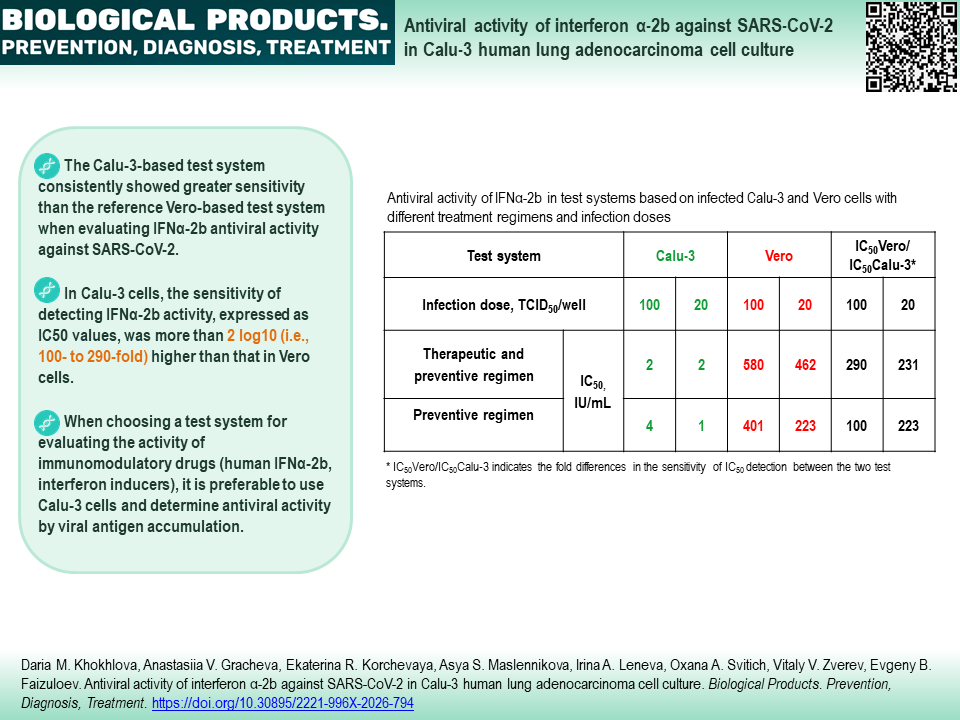
INTRODUCTION. Despite the reclassification of the SARS-CoV-2 coronavirus as an etiological agent of seasonal respiratory viral infections, the problem of developing drugs against COVID-19 remains relevant. The development of antiviral drugs requires an adequate cellular model of infection to search for and test inhibitors of viral reproduction.
AIM. To study the feasibility of using a Calu-3 human lung adenocarcinoma cell culture-based test system to evaluate the antiviral activity of recombinant human interferon α-2b (IFNα-2b) against SARS-CoV-2.
MATERIALS AND METHODS. SARS-CoV-2 coronavirus, Dubrovka strain (GenBank ID: MW514307.1) was grown in African green monkey kidney (Vero) cell culture. The infectious activity of the virus and the antiviral activity of IFNα-2b were determined in Vero and Calu-3 cell cultures. The antiviral activity of IFNα-2b in Calu-3 cells was assessed by viral antigen accumulation (In-Cell ELISA), and in the Vero cell-based reference test system by cell viability (MTT assay).
RESULTS. Optimal conditions for evaluating antiviral activity in Calu-3 cells by measuring viral antigen accumulation in infected cells using In-Cell ELISA have been determined. A study of recombinant IFNα-2b in a Calu-3 cell culture infected with SARS-CoV-2 demonstrated the possibility of highly sensitive determination of antiviral activity indicators such as 50% inhibitory concentration (IC50) and selectivity index. At different infection doses and treatment regimens, the Calu-3-based test system consistently showed greater sensitivity than the reference test system when evaluating IFNα-2b activity. Thus, in Calu-3 cells, the sensitivity of detecting IFNα-2b antiviral activity against SARS-CoV-2, expressed as IC50 values, was more than 2 log10 (i.e., 100- to 290-fold) higher than that in Vero cells. The observed differences in the sensitivity of the two test systems may be due to both the different endpoint measurement methods (viral antigen accumulation vs. cell viability) and the deficiency in interferon response genes in Vero cells.
CONCLUSIONS. When choosing a test system for evaluating the activity of immunomodulatory drugs (human IFNα-2b, interferon inducers), it is preferable to use Calu-3 cells and determine antiviral activity by viral antigen accumulation. In Vero cells, with assessment of antiviral activity based on cell viability, the therapeutic potential of such drugs may be greatly underestimated.

ISSN 2619-1156 (Online)





